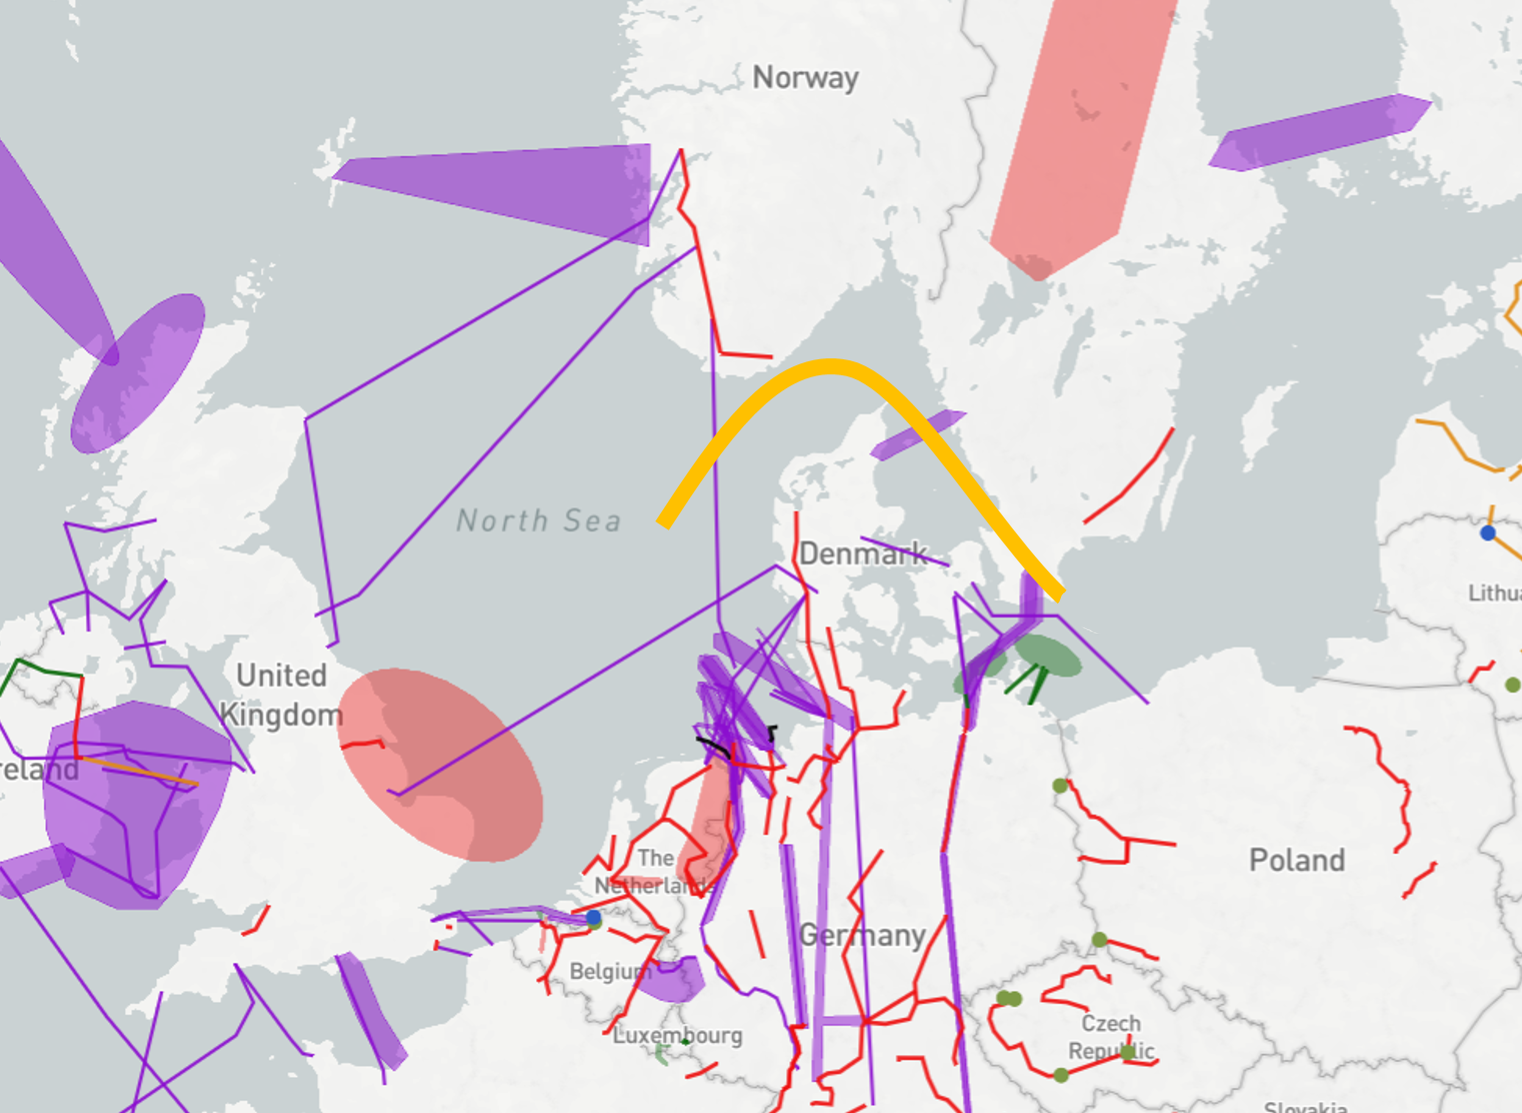
Nordics - Continental Europe West
Interconnecting the hydro-based Nordic system (NO/SE) with the thermal/nuclear/wind-based Continental system
The main drivers for investments in this region are to integrate the hydro-based Nordic system with the thermal/nuclear/wind-based Continental system. This will improve the security of supply both in Norway/Sweden in dry years as well as for the Continental system in periods with negative power balance (low wind, high demand etc.). In addition, the boundary is important both for European market integration, facilitating renewable energy and preparing the power system with lower CO2-emission.
TYNDP findings
The analyses show, that projects between the Nordics and the Continental system do have a reasonably good socio-economic cost/benefit ratio. However, the values are very dependent of the basic price-assumptions (CO2, coal, gas) as well as the energy-balances in each system hence the price-differences between the systems.
In general, projects between the systems leads to decreased CO2-emissions. However, visions with low CO2-prices, may lead to increased coal-fired production and subsequently increase CO2-emissions.
Welfare and Capacity
Market based capacity analysis performed in the TYNDP 2016 shows the potential for increasing the capacity of the Nordics and Continental system. At the same time it is important to pay attention to the assumptions. Bringing CO2, oil, gas, coal prices down to the 201 level will influence the SEW-values in a negative direction. Having a look at SEW/GTC values in the different visions indicates that the energy-balance of the different visions both for the Nordics and Continental countries is the main driver for price differences in the visions hence they drive the SEW-value of connecting the Nordic and Continental systems. The Nordic surplus is very high in Vision 2, which results in a high price difference and subsequent high SEW/GTC-value.
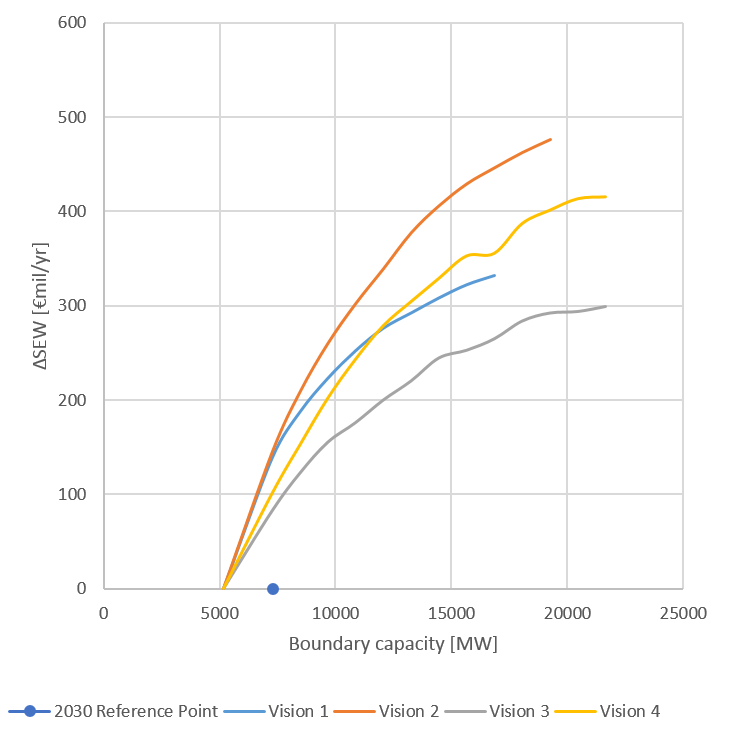
In general, SEW values for projects towards the Nordics are underestimated because studies only take into account an average hydrological year.
Interconnection target for 2030
Making the balance between social welfare gain and infrastructure investment costs for increasing levels of interconnection, the optimal level of interconnection ranges from 4,5 GW to 7 GW. The present and planned investments show that the target capacity will be reached by 2030.