North Seas - regional planning
What congestions is the TYNDP tackling in the North Seas region? What progress for the North Sea Offshore Grid? What about a new long term West-East corridor?
Grid development in RG NS
The region’s characteristics
The Regional Group North Sea covers four separate synchronous power systems (Figure 1), which are interlinked by HVDC interconnectors. Historically, AC technology was used on networks within the synchronous areas; however, this tradition is changing, with some HVDC projects planned for these areas.
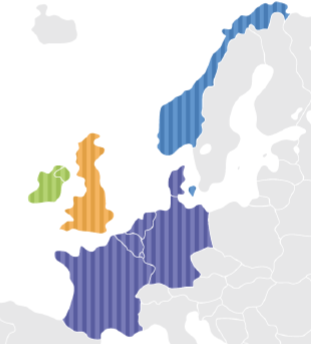
Figure 1 Synchronous Areas of Region Northern Seas
The North Sea Region faces some major challenges over the TYNDP planning period with regards to both grid development and planning. These challenges lead the Region’s TSOs to evaluate, plan and conduct projects aimed at fulfilling the European political energy targets, which are:
a higher integration of the European energy market;
increasing the integration of renewable energy sources (wind, solar and hydro) facilitating lower CO2 emissions;
maintaining the security of supply.
Looking at the region’s generation fleet, there is a general development towards a shift of primary resources; in fact, this has been ongoing for a number of years: The key trends are as follows:
a. A shift from thermal to renewable generation, including a planned nuclear phase out in Belgium, Germany and partially in France; however, Great Britain plans to build new nuclear generation.
b. A shift from coal to gas powered thermal generation.
c. Controllable fossil-fuel generation (gas, coal and to some extent nuclear) are expected to be decommissioned and replaced by less controllable generation (wind and solar power). This requires increased flexibility in the system, including system services for operational purposes enabling the security of supply and regional system adequacy to be maintained.
New interconnectors between the region’s countries and its synchronous areas is expected to contribute to large reduction of regional CO2 emissions.
Drivers of Grid Development in RGNS
By 2030, the discussed changes in the generation mix (elaborated further in the Visions1) project a significant increase in volumes of RES in the North Sea Region compared to today (especially for Visions 3 and 4). As the generation portfolio evolves, the opportunities for electricity trade between market players change accordingly. The grid has to be developed in order to support these new exchange possibilities, facilitating the access to the most economic energy mix, while minimizing grid congestions. Above all, the European targets have to be kept in mind during the planning process.
The region’s main power flows are still expected between Ireland/ Great Britain and Continental Europe (West-East axis ) and also on the region’s North-South axis, i.e. between Norway and the Continent. This trend was previously observed in the TYNDP14, and is confirmed in the current edition. The Continent is characterized by a superposition of these North-South and West-East flows, combined with increasing transit flows resulting from market and RES integration within the Continent itself.
During the first year of the TYNDP16 analysis, additional interconnection capacity requirements had been identified in the ‘Common Planning Studies’, the results of those studies having been published in summer 2015 in the Regional Investment Plan (RegIP). In addition to the TYNDP14 cross-border connections, some new electricity infrastructure projects were identified. They are shown as violet connections in Figure 2 and have been assessed in TYNDP16 together with the known project portfolio. The assessment has been made against the four Visions, which differ from the TYNDP14 visions, resulting in new indicator values for the known projects.
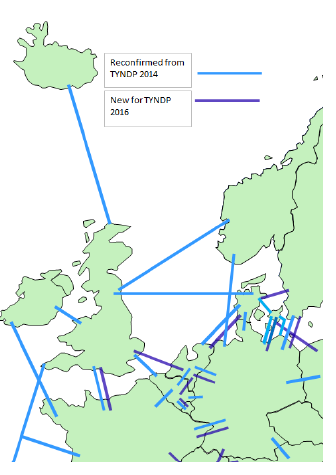
__Figure 2 Schematic synthesis of Pan-EU Cross border projects. New connections investigated in TYNDP16 (blue- known TYNDP14 connections, violet – additional connections) Lines are indicative and can comprise several projects. __ (source: RegIP RGNS 2015, ENTSO-E)
The development of interconnection capacity facilitates cross-border support from areas with surplus electricity capacities to areas facing potential security of supply challenges. Examples of this include during times of planned or unplanned network outages, or during times with low wind or low solar electricity production in countries with high penetrations of RES. Adding interconnectors to the system provides additional system flexibility, and avoids the curtailment of variable renewable energy resources (wind and solar power). This helps to maintain adequate power production across the region while also maintaining a high level of security of supply.
Investment Needs
Which bulk power flows are triggered by the ENTSO-E Visions?
All ENTSO-E Visions fulfil the European RES targets; as a result, the level of RES in the region today is increased to varying degrees of RES penetration2. The Region’s market and network studies have identified potential bulk power flows for 2030 across the major boundaries in the North Sea Region, which subsequently trigger grid developments. These bulk power flows are summarised in both Figure 3 and Figure 4.
The Region’s power flow patterns differ between the Visions. Depending on the Vision, Great Britain is either the Region’s sink or source, i.e. power flows either to or from Great Britain. As a result, projects which serve these power flows will have high utilization hours.
A number of the planned projects connect Scandinavia to GB and the Continent. This results in a high usage of the network between the relevant countries, due to the differing generation portfolio and their load patterns. The Norwegian system is predominantly supplied by hydro generation, with its associated season production pattern; GB and the Continent, meanwhile, are increasingly supplied by wind and solar generation, with their varying hourly patterns.
A planned interconnector between Ireland and France allows power to be imported to Ireland at times of low RES output, with power exported to the continent whenever RES output is high.
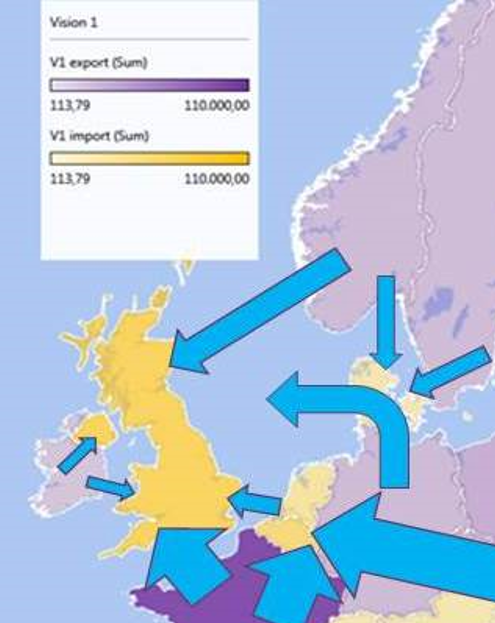
Figure 3 – Vision 1 – Bulk power flows (market perspective, indicative)
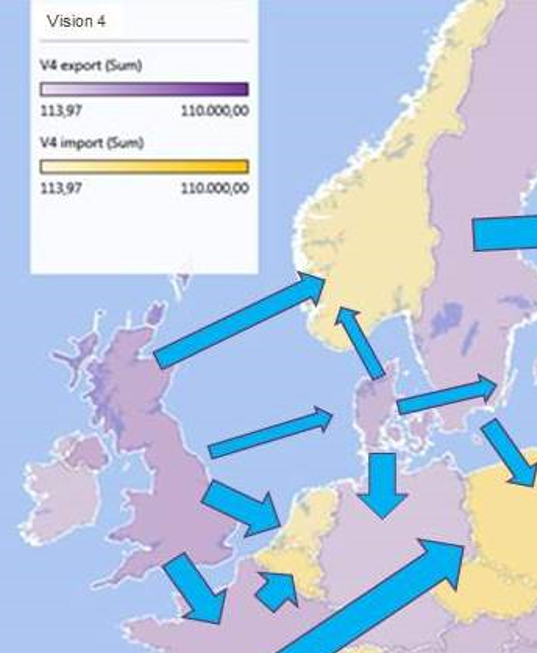
Figure 4 – Vision 4 – Bulk power flows (market perspective, indicative)
In Vision 1, there is a strong generation share from thermal and nuclear power plants, as prices for fossil fuels and CO2 prices are assumed low; in this Vision coal is cheaper than gas. RES increase is assumed to be rather modest in comparison to Vision 4. The Vision sees significant surplus energy in France, the Nordic countries and Germany; conversely, as a result of high gas prices, there is a significant deficit in Great Britain, Belgium and the Netherlands. As a consequence, large power flows can be observed from the Nordics and France towards Great Britain, even using corridors through countries with their own deficits in production, such as Belgium, the Netherlands and Denmark. These power flows are shown in Figure 3.
In Vision 4, the generation shift from thermal to renewables, and from coal to gas, is dominating. This trend is based on respective assumptions on EU policies creating the economic climate that stimulates significant investment in renewable generation projects; a high CO2-price is assumed in this Vision. Additionally, RES is assumed to be built in those areas with abundant resources, i.e. additional wind generation is assumed in GB and IE, and solar generation is assumed in southern Europe. Demand has slightly increased in some countries (NO, GB, FR, IE) compared to Vision 1, while it is more or less constant in NL, DE and BE. Vision 4 sees more uniform net annual country balances across the region when compared to Vision 1, with net balances reversing for some countries. Great Britain, and Denmark are now areas of surplus, while France remains in surplus, but at a reduced level. The deficit in Belgium and the Netherlands is reduced, while Norway exhibits a slight deficit. Net power flows across the region are both smaller and in reversed directions compared to Vision 1. These trends can be observed in Figure 4.
Figure 3 and Figure 4 represent annual averages, and therefore do not reflect the hourly volatility. This volatility might be high, resulting in high infrastructure utilization. Even though Vision 1 appears to result in higher regional flows than in Vision 4 due to seemingly higher average price differences and related annual averages than in Vision 4, the actual flows in Vision 4 might anyway be higher when evaluating the hourly price volatility.
When comparing Vision 4 of TYNDP14 and TYNDP16, there is a reduction in the assumptions of installed wind energy in both GB and IE. Consequently, the power flows have changed. This results in different assessment results in particular for many projects towards Great Britain, which yield less optimistic RES integration indicator results in this TYNDP compared to TYNDP14.
Which Grid Development is necessary to transport these flows?
The market and network study processes have identified bottlenecks in the European electricity system that will persist or emerge in the coming decade, unless new transmission assets are developed.
Figure 5 and Figure 6 show the congested areas in the North Sea Region for Vision 1 and 4 respectively; i.e. the locations where the transfer capability is insufficient to accommodate the likely bulk power flows resulting from the reference market exchange capacities as defined in the 2030 scenarios. The assumed status of the grid is that of the reference grid- all medium term and long term interconnection projects are implemented, while future projects are assumed not yet built. Figure 6 focuses on the area around the English Channel, as it is the only area of the network showing significant change from Vision 1.
The resulting congestions are as follows:
Central-Western Europe: congestions are spread out across the area due to the highly meshed and integrated system resulting in substantial transit flows. The utilization of phase-shifting-transformers has been applied to balance the flows locally; however, congestions still remain (as depicted) and underline the relevance of the future projects under study to help alleviate these congestions. In Vision 4, the transport of energy from to GB to Central Europe, combined with a high penetration of RES, amplifies this impact.
UK and IE/NI: congestions are concentrated along the coastal areas where the interconnectors are integrated. Congestions are generally comparable between Vision 1 and Vision 4;
Denmark: no congestions have been detected, neither in Vision 1 nor in Vision 4.
Germany: possible congestions spread mainly along the North-South axis in case of delays in internal German grid extensions. They are described in more detail in the German National Development Plan together with projects mitigating them.
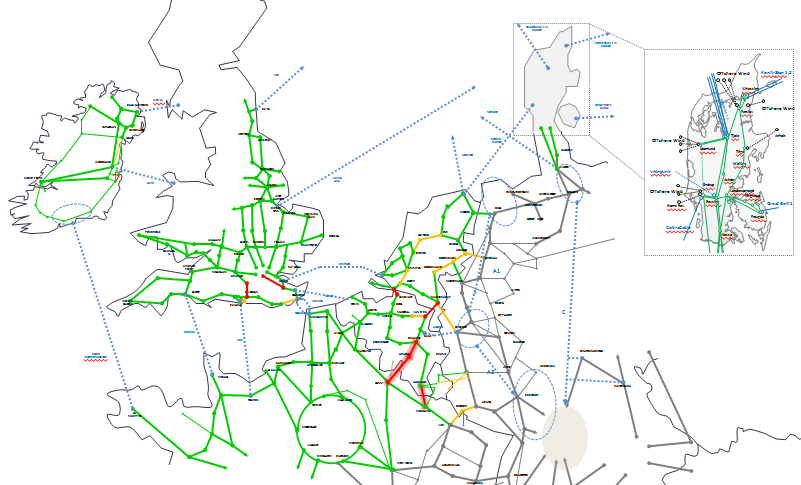
Figure 5: Congested areas in the North Sea region – 2030 Vision 1. (Green when no congestion, yellow for occasional N-1 congestion, red for structural N-1 congestion, and highlighted red for bottleneck in N)
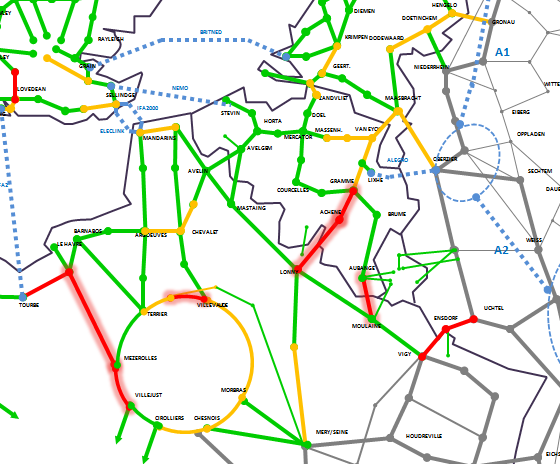
Figure 6: Congested areas in the North Sea region – 2030 Vision 4 (Green when no congestion, yellow for occasional N-1 congestion, red for structural N-1 congestion, and highlighted red for bottleneck in N)
below highlights the main drivers behind these congestions, and describes ongoing investigations concerning potential solutions to alleviate these congestions, where relevant. These investigations are reflected via multiple projects introduced in the TYNDP16 and/or in the relevant national development plans as projects ‘under consideration’. The extent into which these investigations will result in concrete projects, and the reinforcement solutions that these projects would entail, depend heavily on:
The firmness of the congestions across the scenario framework. i.e. whether congestions are observed across all scenarios, and hence the relevance of solutions in all scenarios;
The appropriateness and added value of the solutions with respect to enabling the full potential of market integration, beyond the reference market exchange capacities. For example, further increasing the transport capacity across the boundary between GB and Central Europe would yield even higher bulk power flows. This would enhance the need to strengthen the grid in the respective congested areas, and trigger the requirement to investigate various options to reach the optimal solution, from both a technical and economic perspective. In the example of the boundary between GB and Central Europe, this consideration has already materialized in the introduction of a “Long-term conceptual West-East corridor”.
Table 1 Main Drivers for identified congestions and solutions under investigation
| Area | Severity | Driver | Proposed solutions |
|---|---|---|---|
| Netherlands – Belgium | Vision 1: Structural bottleneck in N-1 Vision 4: Occasional bottleneck in N-1 | High flows for import into BE and north-south transit, highest in vision 1. | #262 |
| Internal Belgian Backbone East | In both visions occasional bottleneck in N-1 | North-south flow combined with concentration of gas-fired generation. | #252 |
| Germany – Netherlands | In both Visions occasional bottlenecks on multiple cross-border lines. Vision 4: Meeden-Diele as additional occasional bottleneck. | Flows from the North of Germany to the South-(West) area of CWE. In Vision 4, additional wind production in the North of Germany triggers additional congestion on the Northern part of the border. | #113 #245 #256 |
| Netherlands internal 380kV ring | In both Visions occasional bottlenecks on multiple 380 kV internal ring lines. | Flows from the North of Germany and the North of the Netherlands to the South-(West) area of CWE. | #103 |
| France – Belgium | Structural bottleneck in both visions, with high loadings already in N condition. | High flows for import into BE and south-north transit, Planned nuclear phase out in Belgium emphasizes impact on eastern 400 kV axis. | #173 #280 |
| Germany – Luxembourg | Occasional bottleneck in Vision 1 | Transit flow Germany-Luxemburg-Belgium in both directions. | |
| France – Germany (Vigy-Ensdorf-Uchtelfangen axis) | Vision 1 : Occasional bottleneck in N-1 Vision 4 : Structural bottleneck in N-1 | High volatile west-east and east-west flows through France and Germany due to RES development. Highest in Vision 4. | #244 |
| North-West area France (incl. Paris ring) | Structural bottleneck in vision 4, for some parts even in N condition. | High flows from North-West coast of France to main consumption area (Paris). Driven by combination of large imports from UK with high offshore wind development in the Western coastal area of France, replacing into some extent classical production around the Paris area. | Projects under consideration in RTE national development plan (mainly substation upgrades in Normandy and line reinforcement Paris ring) |
| UK South Coast | Vision 1: Structural bottleneck in N-1 Vision 4: Occasional bottleneck in N-1 | High imports from Continental Europe & Norway, resulting into high flows from UK South Coast to London area load center. | |
| Ireland East Coast | Vision 1 and Vision 4: occasional bottleneck in N-1, however, some structural bottlenecks in Dublin area. | High imports from France, coupled with a high usage of thermal generation in the Dublin area, result in heavy south to north flows causing some overloads under contingency conditions. | |
| German Internal Grid and border to Denmark | bottlenecks without internal grid extensions as described in project sheets | High flows from North to South – driven by combination of high RES infeed in the North and high consumption in the South with phase out of power stations in the South. | Projects under development in DE national development plan |
Building projects across the region’s main boundaries
Figure 7 below gives some information about the boundary around the Eastern side of Great Britain, i.e. towards the Continent and Scandinavia. The figure illustrates how an increase in the boundary capacity impacts the socio-economic welfare. The present capacity across this boundary is 3 GW (represented by the blue dot at the bottom of the graph). This capacity will increase to c.10.2 GW by the year 2030 (represented by the vertical green line), and is the reference capacity used for TOOT analyses, i.e. comprising the non-competing medium-term and long-term projects.
Projects beyond 2030 and less mature projects were assessed with PINT analysis and are represented by the curves to the right of the 2030 capacity, up to a level of 25 GW.
The benefits of infrastructure projects across the Eastern Great Britain boundary depends on how the future develops; in terms of SEW, the benefits are highest for Vision 2 (blue curve) and lowest for Vision 1 (green curve). When considering other indicators different Visions perform best; for example, in Vision 4 the CO2 savings are highest, while the integration of RES is highest in Vision 3. The results demonstrate how the different future evolutions represented by the scenarios impact on the viability of projects. The choice has to be made at a political level concerning which future the region should aim for.
As the SEW/GTC curves form so-called saturation curves, the socio economic benefit gets the smaller as more projects are built. This is due to the fact that the main benefits are already exploited by the first projects being built, i.e. the Medium Term and Long Term projects, which will be on the steeper part of the curves. The figure illustrates the projects’ dependency of the future evolving, and of the number of new projects in the area.
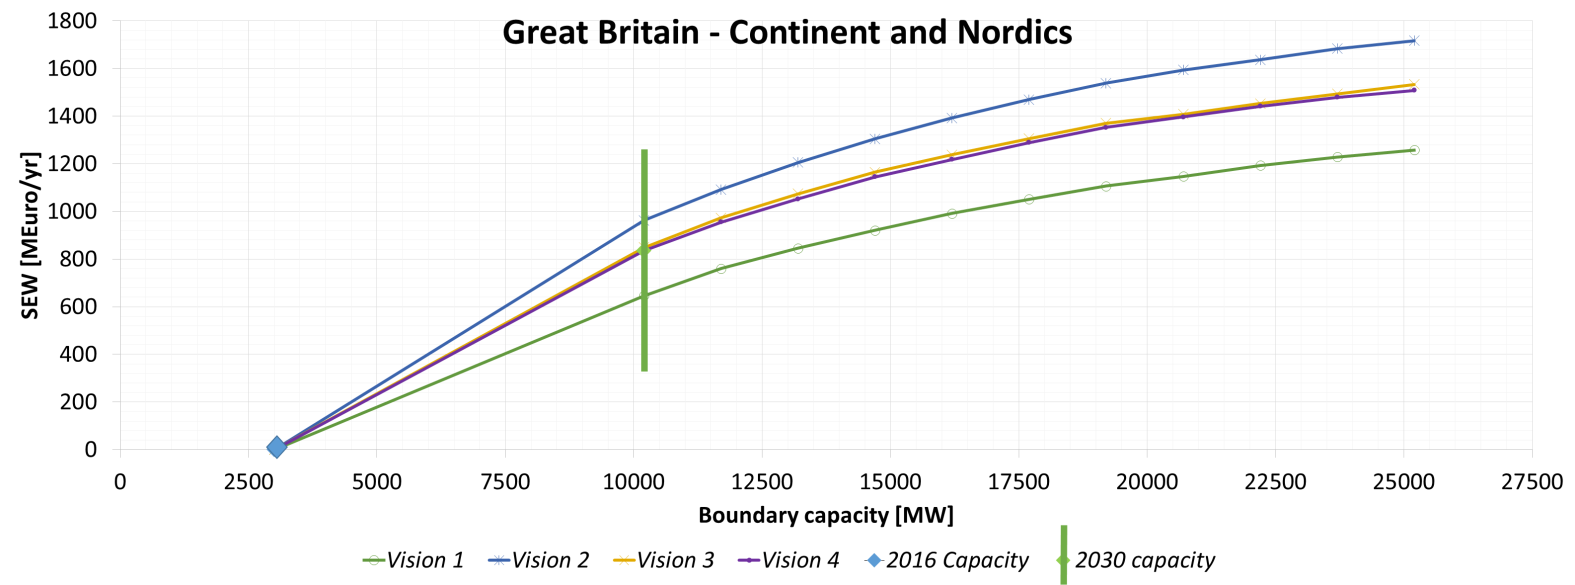
Figure 7 Boundary capacity
Another boundary is located between the Irish and the British systems. In this area, a number of future projects are envisaged, focussing on both a closer connection between the systems, and the transport of significant quantities of RES from IE to GB.
The North Seas Region currently faces bulk market flows on the North-South axis between Nordic and Continental countries. These are triggered by cheap Nordic hydro or wind generation sending power to the thermal /wind Continental system. These power flows cross the main boundary between the Nordic/ Continental system (see Exec summary, figure 3), and the boundary DKW/DE, as described in TYNDP14.
In this context, the TYNDP16 analyses also show that for the future Visions, the internal German projects will deliver large European benefits, underlining the need for their realization. Some of these projects are already under construction. The status of these projects is described in the project assessment sheets.
Why the region’s project- assessment results are often less optimistic than in 2014
SEW, indicators:
The TYNDP16 results for the regional projects’ SEW indicators are often lower compared to their values in TYNDP14. This can be explained by two main causes:
The number of projects in the region’s “reference case” is higher compared to the 2014 reference case. When applying the TOOT (take one out at a time) method, this implies the project under investigation is always the last project to be built out of the whole portfolio. With the increase in the number of projects, there is less benefit left for the ‘last’ project.
The distribution of RES in the generation portfolio has been set up in a more efficient manner compared to TYNDP14, e.g. by developing RES in better locations (see chapter 2.1), especially in Vision 3 and Vision 4. This reflects the potential European collaboration on RES support schemes and results in a reduced need for interconnections. This also has a significant impact on the RES and CO2 indicators.
Losses
The increase of interconnection capacity enables power to flow from one side of Europe to the other, in line with the political objectives. This increase can thus, in some cases, be accompanied by an expected increase in grid losses. Some projects facilitate entirely new flows which would not be possible without the project. This phenomenon has been observed for several of the Region’s projects during their assessments. These increased losses can be interpreted as the price to pay for fulfilling the European Energy targets.
In general, the assessment of losses variations induced by new projects has been improved in TYNDP16 when compared to TYNDP14. A comprehensive all year round simulation and European-wide DC-proxy computation has been applied to obtain a view on the region’s losses. The results must, however, be treated with caution; due to the very high sensitivity of losses to generation assumptions, in particular the location of generation units.
Climatic effects
It is important to note when looking at projects connecting to Norway that this TYNDP16 considered only one hydrological year (a ‘normal’ year); the Nordic TSOs and their project partners usually analyse up to 50 hydrological years for the more detailed elaboration of business cases. The benefits for these projects are typically greatest during dry and wet years, when the power flows across the projects are higher than in normal years. For TYNDP purposes a simplified approach has been chosen.
In a similar manner, some additional parallel studies have shown that consideration of multiple climatic years will cause larger ranges for the indicators than those given in the project sheets. This is especially important for projects affected by large volumes of RES generation and high quantities of temperature dependant load.
Adequacy contribution
The TYNDP scenarios assume a high level of autonomy on national level to reach adequacy (security-of-supply). The potential for further regional cooperation in ensuring system adequacy, including the contribution of interconnections, allow adequacy benefits to be captured, in addition to the benefits depicted in the TYNDP framework.
Development of the Northern Seas offshore grid infrastructure
The offshore grid infrastructure has already been under development for several decades, and will continue evolving. The considerable number of infrastructure projects in the Northern Seas area will deliver significant regional benefits. Their individual cost-benefit analysis is described in the project sheets, while a combination of the whole portfolio crossing the Northern European waters is provided in this section.
This plan focuses by nature more on the Pan-European dimension, which means increased focus on interconnection projects rather than on a detailed look at single offshore wind projects and their connection options. This does not mean, however, that ENTSO-E neglects the possible development of hybrid projects. Investigations on related options have been made earlier (see box below) and are currently subject to several European research projects, which are investigating these options and how to solve the associated technical details, e.g. the PROMOTION project3. A study on regulatory matters has recently been published by the EC as well4. ENTSO-E welcomes these and related projects and initiatives and looks forward to debate the conclusions. TSOs and Third Party project promoters will continue observing and/or actively participating in these projects. Outcomes will be applied based on case by case decisions when further developing the Northern Seas offshore grid infrastructure.
The individual projects contributing to the Northern Seas Offshore Grid Infrastructure have different sizes and different degrees of maturity – some will already be commissioned by 2020, others more towards the end of the decade (Table 2). The current preferred design is point-to-point, as this is still more cost efficient compared to multiterminal offshore solutions. It is still cheaper to build and operate AC/ DC converter stations onshore, instead of offshore.
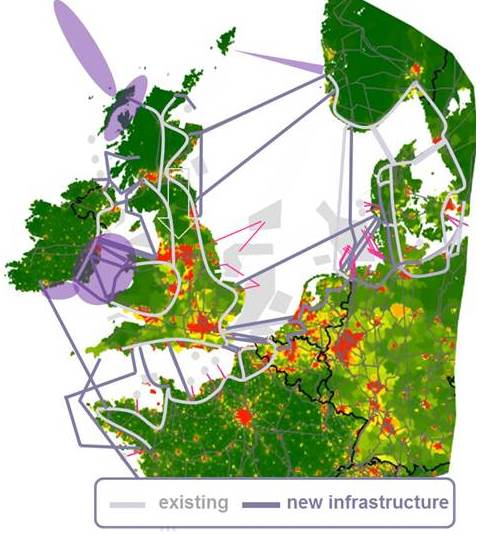
Figure 8 Northern Seas Offshore Grid Infrastructure 2030 - General Concept
Project 271 is composed of
Table 2 – Components of Project 271
| Country/ies | Project ID | Project Name | Com-missioning | Offshore interconnection Capacity [MW] |
|---|---|---|---|---|
| FR, GB | 25 | IFA 2 | 2020 (MT) | 1000 |
| FR, GB | 153 | France – Alderney – Britain (FAB) | 2022 (MT) | 1400 |
| FR, GB | 172 | Eleclink | 2018 (MT) | 1000 |
| BE, GB | 74 | Thames Estuary Cluster (NEMO) | 2019 (MT) | 1000 |
| BE, GB | 121 | 2nd Interconnector Belgium – UK | 2025 (FP) | 1000 |
| FR, IE | 107 | Celtic Interconnector | 2026 (LT) | 700 |
| GB, NI | 189 | Irish-Scottish Isles | 2020-2030 (FP) | 1000 |
| GB, NO | 110 | North Sea Link | 2021 (MT) | 1400 |
| GB, NO | 190 | NorthConnect | 2022 (MT) | 1400 |
| DE, NO | 37 | NordLink | 2020 (MT) | 1400 |
| DKW, NL | 71 | COBRA Cable | 2019 (MT) | 700 |
| DKW, GB | 167 | VIKING link | 2022 (MT | 1400 |
| FR, GB | 247 | AQUIND Interconnector (Aquind Ltd.) | 2020 (FP) | 2000 |
| FR, GB | 285 | Gridlink | 2021 (FP) | 1500 |
| DKW, NL | 237 | COBRA Cable II | ( > 2030) FP | 700 |
| GB-NL | 260 | New GB –NL interconnector | 2030 (FP) | 1000 |
| IE-GB | 286 | Greenlink | 2022 (FP) | 700 |
| IE-GB | 287 | Greenwire South | 2023 (FP) | 1300 |
| IE-GB | 290 | Greenwire North | 2023 (FP) | 1000 |
| IE-GB | 292 | GreenConnect | 2023 (FP) | 700 |
| GB-NO | 294 | Maali | 2023 (FP) | 600 |
| NI-GB | 295 | Gallant | 2023 (FP) | 500 |
| IE, GB | 289 | MAREX | 2020 (FP) | 1500 |
| BE | 75 | STEVIN & Modular Offshore Grid | 2019 (MT) | 3000 (offshore capacity + 74 NEMO) |
| BE | 120 | 2nd Offshore-Onshore Corridor | 2025 (FP) | 2000 (additional offshore capacity in V3 & V4) |
| IE, GB | 291 | Greenwire Loop | 2022 (FP) | 700 |
The level of on- and offshore wind considered in the TYNDP16 2030 analyses differs between the grey and green Visions by a factor of 1,4 (onshore) and ~2.5 (offshore) – with a significant lower max level for offshore wind (80 GW) compared to the 110 GW max level considered in TYNDP14.
This change stems from an alignment with the 2030 Energy Union targets, and reflects political signals at national level, hence the previous max level assumed in TYNDP14 is rather to be considered as additional potential looking at the pathway towards 2050.
It has to be mentioned that TYNDP analyses in general considers the development of the complete production fleet, i.e. includes all fuel types5, driving the flows across Europe.
Table 3 – On- and Offshore wind considered in the Visions in RGNS countries
| GW | 2020 | Vision 1 | Vision 2 | Vision 3 | Vision 4 |
|---|---|---|---|---|---|
| Offshore wind | 24.1 | 30.6 | 30.8 | 72.2 | 79.6 |
| Onshore wind | 94.0 | 110.9 | 124.7 | 155.1 | 154.5 |
Recall of earlier studies’ results:
Due to former studies looking at higher offshore wind level, conclusions made at that time are still valid and are shortly recalled below. All studies looked at a time horizon of 2030, which implies, that the level investigated at that time might materialize even later.
The 2012 NSCOGI study compared different designs “radial and meshed”. The meshed design had the same interconnection level as the radial design but included hybrid projects; i.e. combinations of offshore wind farms and interconnectors in single projects additionally to single offshore meshes. Conclusion were that for levels of ~55 GW offshore wind, both designs resulted in rather similar infrastructure expenses (~30 bn€), showing a slight preference for the design including hybrid projects with respect to the benefits. This amount is to be spent on top of the 77 bn€ regional expenses to reach the 2020 “starting” level of the study identified in the TYNDP12. The 117 GW offshore wind sensitivity in the same study showed already differences in identified on- and offshore infrastructure investments (either 53 or 57 bn€ - due to saved km infrastructure lengths) between 2020 and 2030.
In the TYNDP14 edtion comparison was made between the above mentioned NSCOGI grid study, the TYNDP14 analyses itself and a study launched by the EC as well6. Conclusions drawn from this comparison were that the Northern Seas Offshore Grid Infrastructure will be composed of various kinds of technology (AC and DC technologies) and of various designs as well. The studies had used the term “meshed” in different ways, thus ENTSO-E closed this discussion: ENTSO-E assumes a parallel development different designs: i) point-to-point interconnections, ii) radial offshore wind connections (single or via hubs), iii) hybrid projects, (combination of offshore wind connections and interconnections) and iv) multiterminal offshore platforms combining interconnections. ENTSO-E foresees a modular and stepwise offshore grid development with choices being made on a case-by-case basis, evaluating technical and economic parameters. A compact hybrid offshore design could be envisaged in cases, where scheduling and technology required for interconnection and wind connection (DC or AC / voltage level) match. In any case, the cooperation between all stakeholders of all countries involved is essential.
Table 4 – Assessment Results for Project 271
| Vision 1 | Vision 2 | Vision 3 | Vision 4 | |
|---|---|---|---|---|
| SEW [M€/y] | 1990 +/- 110 | 2520 +/- 10 | 2380 +/- 170 | 2540 +/- 80 |
| CO2 [kT/y] | 9900 +/- 300 | -8000 +/- 2000 | -12700 +/- 2800 | -16100 +/- 3400 |
| RES [GWh/y] | 15250 +/- 150 | 26280 +/- 2280 | 28800 +/- 3500 | 24290 +/- 2010 |
| Costs [M€] | 18600 +/- 6200 | 18600 +/- 6200 | 18600 +/- 6200 | 18600 +/- 6200 |
Comparing the results for the different visions, it can be observed that no matter what future evolves, the North Sea Region aims at building a robust infrastructure, fulfilling the needs of the different visions: While the infrastructure in Vision 1 is merely used for the transport of conventional energy (i.e. regional CO2 emissions increase, regional RES integration is smallest), the SEW/GTC benefits are in the same order of size magnitude as for the other three Visions. The results illustrate the complementariness between the different projects integrated in the offshore grid infrastructure, jointly delivering a substantial market and RES integration benefit in line with the assumptions and corresponding needs of the different visions.
It can be concluded that the project package proposed by the Regional Group North Sea TSOs and Third Parties is fit for purpose.
Development beyond 2030
When looking beyond 2030, at a time horizon such as 2050, it is expected that the share of renewable energy of energy consumption will further increase, and within the context of a policy driven transition towards a low carbon future, the conventional generation portfolio will subsequently change. Given these expectations along with the potential for further RES development in Europe, it is reasonable to develop a high level long-term project concept that may come into focus for future scenarios. This conceptual idea is driven by objectives such as integration of the electricity market and RES integration.
Consequently, a long-term conceptual project has been added at Regional Group level – the ‘Long Term Conceptual West-East Corridor’ (Figure 9). This project is put on top of the ‘Northern Seas Offshore Grid infrastructure’ described in chapter 3.
New Long-term conceptual West-East Corridor (261)
In the Regional Investment Plan 2015 – North Sea region” a typical bulk power flow pattern from Great Britain to Central Europe or vice versa had been identified, triggering massive onshore AC reinforcements in Great Britain and the Central West region as well. For the long term perspective beyond the year 2030, a set of variants satisfying this corridor could be investigated in further studies. These might e.g. include i) relatively short point-to-point DC interconnections and related AC onshore grid reinforcements on both sides or ii) longer DC connections off- and onshore with possible multi-terminal take-off points in Benelux, France and Germany, or iii) longer offshore DC connections from Great Britain directly to Central Europe. Potential balances between the lengths of DC interconnectors and internal grid reinforcements have to be identified, essentially enabling further market integration between Great Britain and Central Europe. Defining the optimal architecture is subject to further analysis weighting the cost and benefits of different variants considering multiple purposes.
Parameters to be considered are e.g. the relation between costs and benefits per added capacity, and the sensitivity towards the level of offshore wind capacity. Also landing points in both synchronous areas have to be chosen carefully, considering hybrid options with multi-terminal solutions as well. This might include a potential to avoid onshore reinforcements for offshore wind accommodation.
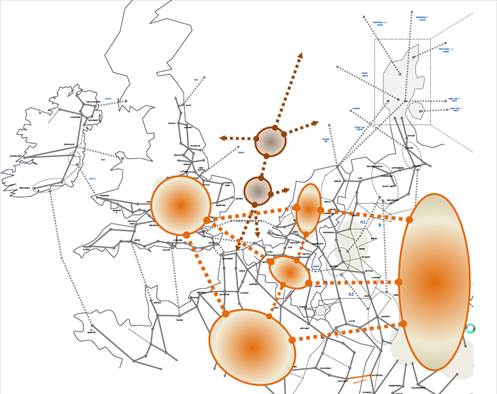
Figure 9 West-East conceptual project – beyond 2030
See report on “Future system perspectives” ↩
For elaboration of the Visions see the report ”Future System Perspectives” ↩
Link to EC press release and study: https://ec.europa.eu/energy/en/news/north-and-irish-sea-renewable-energy-potential-could-be-boosted-more-cooperation ↩
See Insight report “Future System Perspectives” ↩
“Benefits of a meshed offshore grid design in the Northern Seas Region”, summer 2014 ↩