Future system perspectives
Where does one start to plan network development 15 years ahead? How to make sure the assumptions used are realistic and at the same time future-looking enough? How to broaden the scope of possibilities but maintain a sufficient level of feasibility? Learn how long-term grid planning is done in the TYNDP.
How to plan the grid of the future?
Building a transmission infrastructure project takes ten to fifteen years. The lifetime of a transmission asset is on average fifty years. The costs of building transmission infrastructure is high. The recovery of these costs takes several years and can be measured through the benefits that the transmission asset brings to society.
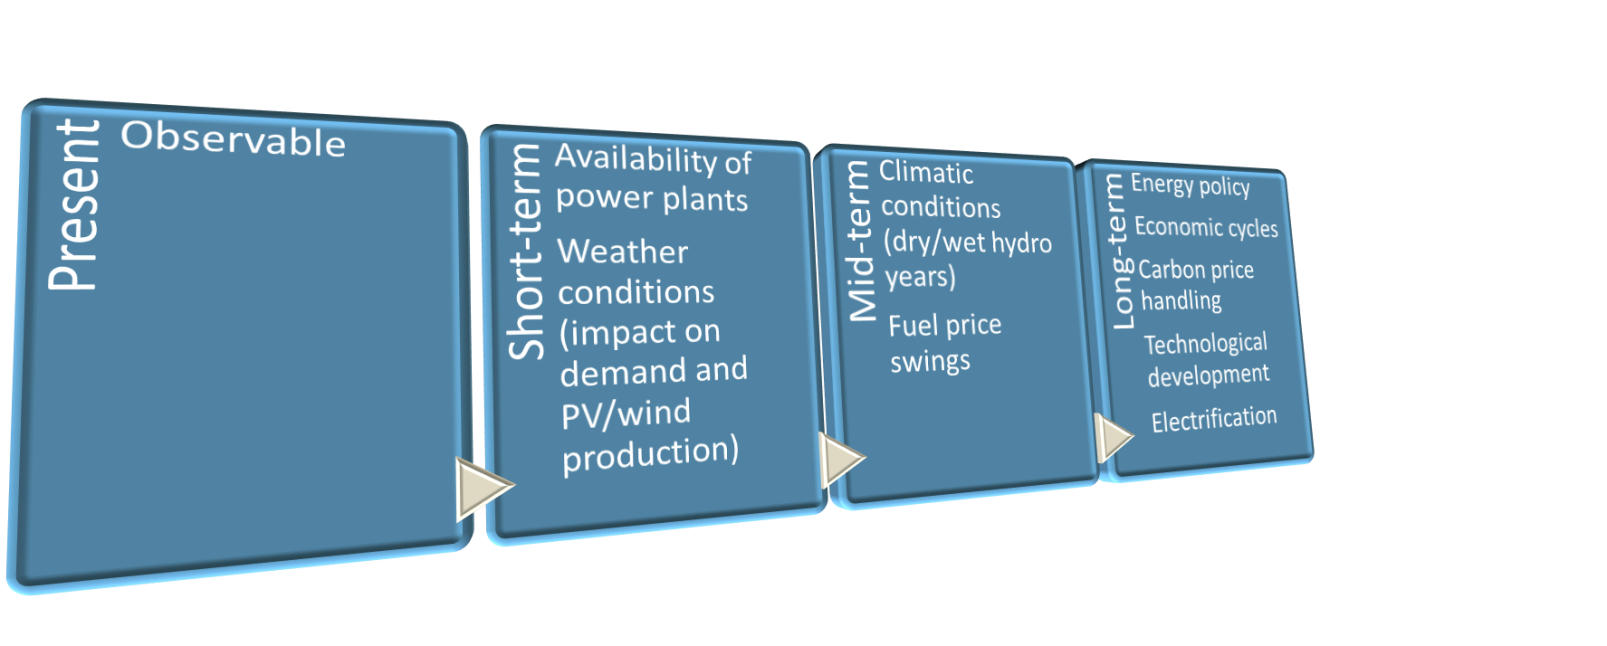
Because uncertainties and investment costs are high, any long-term grid planning requires to test each project against a multiplicity of plausible futures for the power system. This is why the 10-year network development plan benchmarks projects against a set of visions for the power system up to 2030.
Which time horizons does the TYNDP 2016 analyse?
Since 2010, ENTSO-E prepares a TYNDP every two years. The 2016 TYNDP focuses on the year 2030, as was already the case in the 2014 edition.
In 2014 the EU Council set itself new targets for the period between 2020 and 2030.
The 2030 targets:
a 40% cut in greenhouse gas emissions compared to 1990 levels
at least a 27% share of renewable energy consumption
at least 27% energy savings compared with the business-as-usual scenario
The interconnection targets:
10% by 2020; 15% by 2030 taking into account costs and trade flows
These EU targets give strong directions for grid development up to 2030. The TYNDP objective is to give complete, unbiased and transparent information to decision makers and the general public on what transmission infrastructure is needed to enable these targets to be met. For the long-term horizon 2030, four contrasting visions are presented which differ in terms of energy governance and ambitions in terms of renewables.
The visions for 2030 used in the TYNDP 2016 build on the visions used in the TYNDP 2014.
In the 2016 edition, a scenario looking at 2020 has been added. It allows promoters to have their projects valued at a mid-term horizon. This 2020 scenario is defined as the last point in time before uncertainties increase to a level where a broader envelope of potential futures is required. It is called the “expected progress” or ‘best estimate” scenario. The four 2030 visions provide the frame within which the future is likely to occur but do not have probability of occurrence attached to them.
What are the main storylines of the TYNDP 2016 visions?
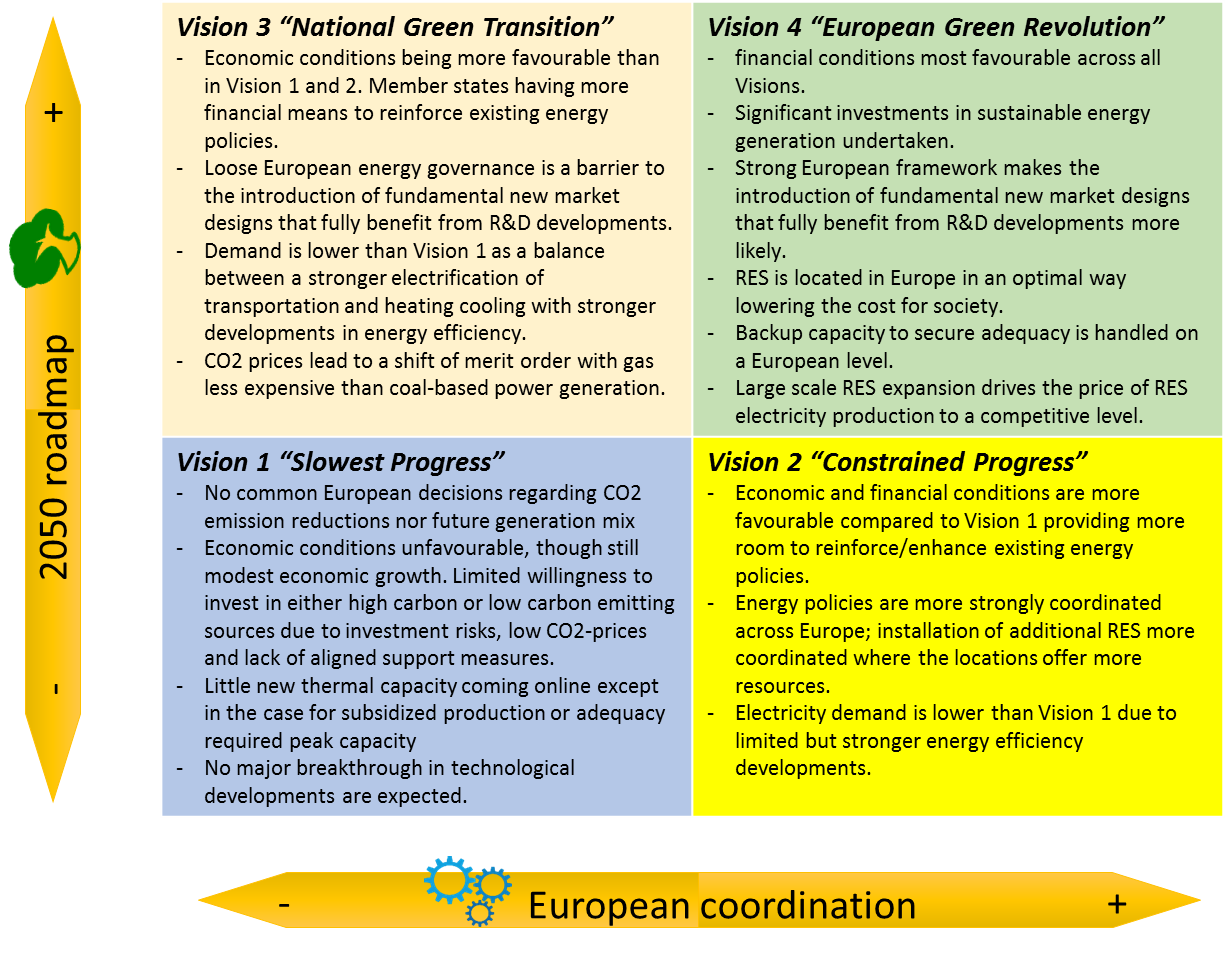
The storylines behind the four 2030 visions and the expected-progress 2020 scenario were co-created with stakeholders. There is an evolution from the TYNDP 2014 scenario set, integrating new energy policies and various suggestions from past TYNDPs. The four 2030 visions are built around two axes:
The level of centralisation in the governance of the decarbonisation policies (more European or more national).
The level of progress in meeting the European targets for the reduction of greenhouse gas emissions
What can I find in each vision?
All four visions and the 2020 scenario include for the whole of Europe:
- Installed generation capacity, per technology and per country
- Energy supplied on a yearly basis per technology and per country
- Demand profiles for a full year, with hourly resolution
- Import/export energy balances for each country
- Assumptions on generation efficiencies, fuel prices and carbon cost
All details are accessible in the TYNDP 2016 Scenario Development Report.
Key takeaways from the 2016 visions?
Energy produced per technology in each visions/scenario
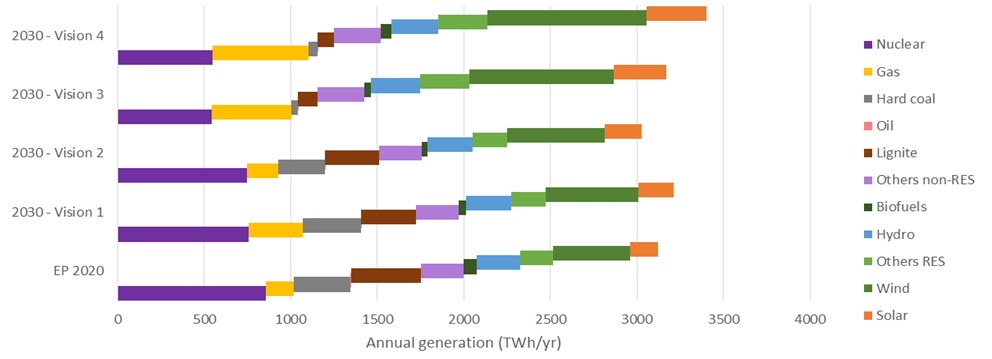
Prospects for total energy production in 2030 range from the 2020 expected level of about 3100 TWh to 3400 TWh in the Vision 4. Visions 1 and 2 see a substantial share of coal based generation, while carbon pricing in Vision 3 and 4 shifts this generation towards gas-fired plants.
Visions 3 and 4 also unlock more generation from renewables as wind and solar due to more favourable economic conditions and stimuli, and in Vision 4 a much more enhanced pan-European coordination of support schemes.
Demand evolution and %RES share
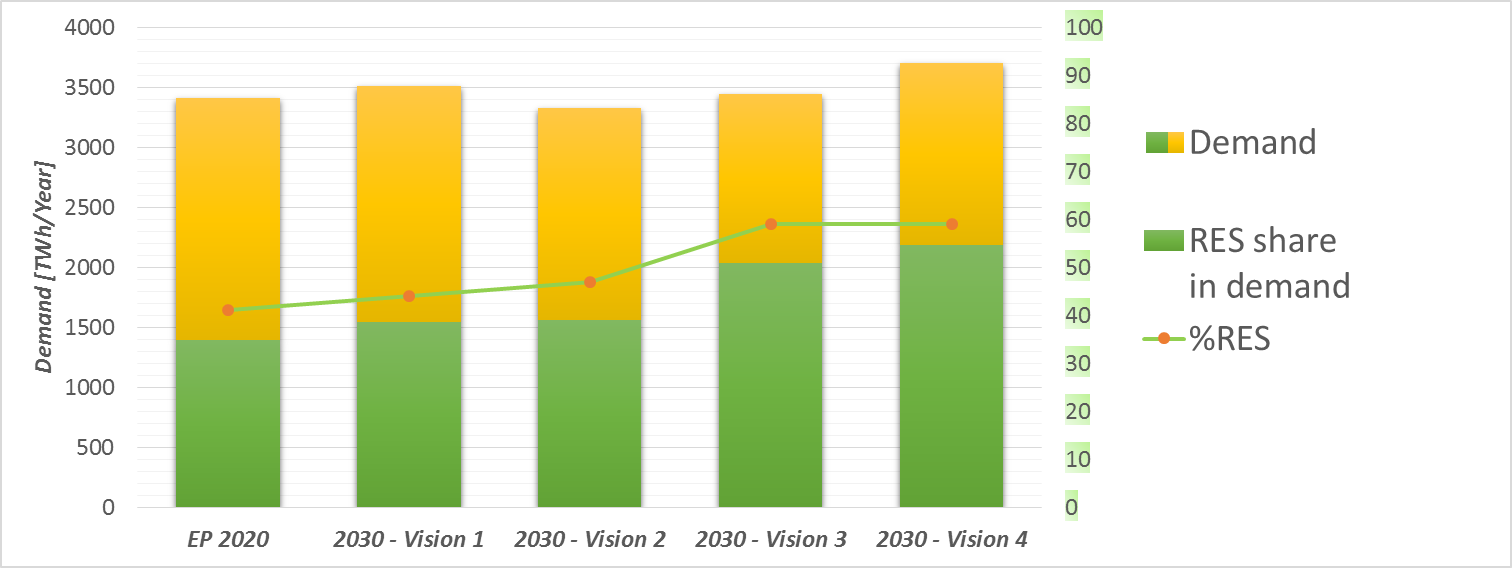
Total electricity consumption for 2030 ranges from 2020 levels (3406 TWh) to an increase across the coming decade up to 3700 TWh. Taking into account renewable based generation, this results in a %RES share of 44% in Vision 1 up to 59% in Vision 3 and 4. Note that Vision 3 is characterized by favourable economic conditions focusing on energy efficient measures. If energy savings materialize less, the resulting %RES share will drop. In any case all 2030 Visions are considered in line with the EU RES target for 2030.
Investment drive for renewables
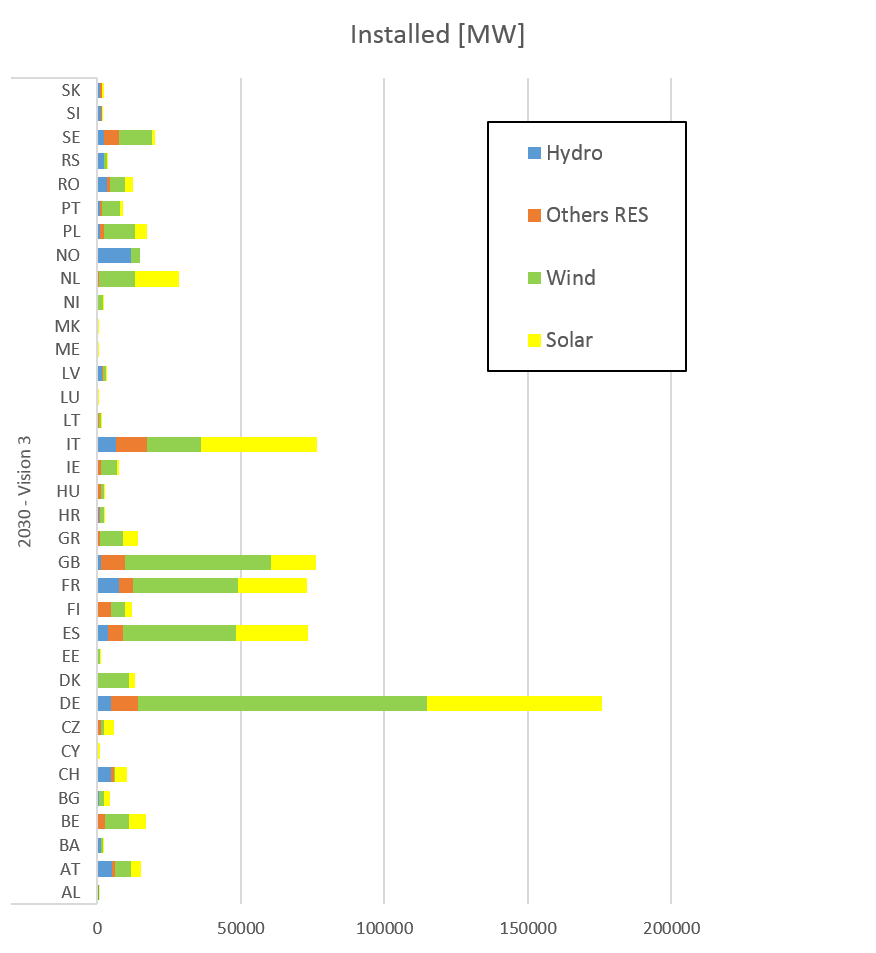
Levels of installed generation rise intensely up to 1100 GW in 2020, and possibly up to 1400GW in 2030 (Vision 4) across the ENTSO-E perimeter. The levels of installed solar and wind account for 390 to 420 GW in the various 2030 scenarios.
Country balances
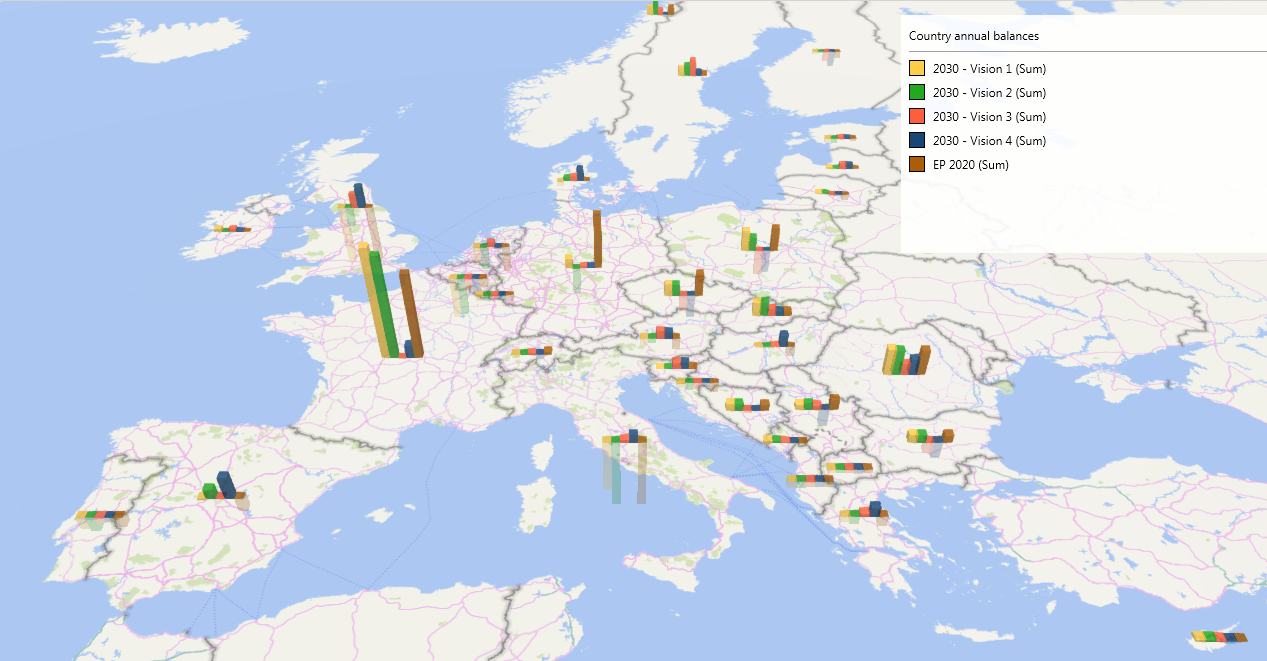
Evolutions in installed capacity translate into different patterns of import/export for all countries. Comparing the four visions, several countries see different net balances, which will be analysed in more detail for the transmission assets planned in the TYNDP2030 grid. This analysis also takes into account the temporary peak flows occurring in the year. The country balances reflected in the figure already take into account the mature TYNDP investments (mid-term and long-term projects). Positive bars refer to annual net export; negative ones to net import. All underlying data can be found in the TYNDP2016 Scenario Development Report.
CO2 emissions in the electricity sector
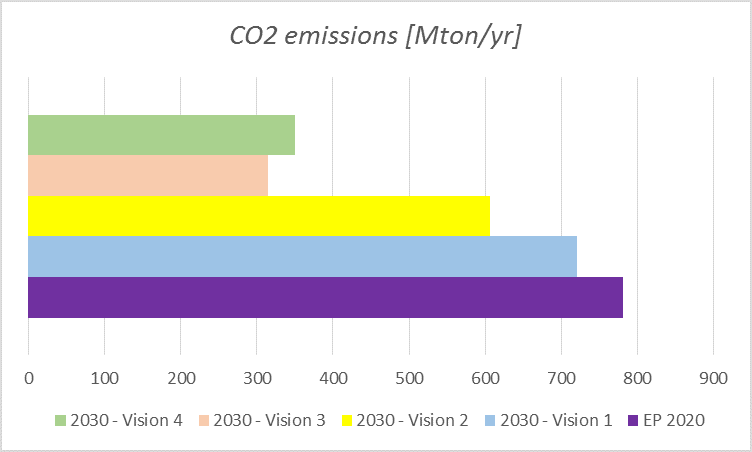
Carbon emissions drop substantially across all four 2030 Visions as can be expected from the shift to more RES-based generation. Compared to 1990 level the decrease ranges from 49 to 75 %, all contributing to the EU-wide target of 40% total carbon reduction, and the overall roadmap for environmental targets of the entire European electricity sector.
How were the visions of the TYNDP 2016 developed?
Involved actors
The TYNDP 2030 visions do not aim to present a most likely, nor a more desired snapshot of the future power system. They cover a set of plausible futures which allows to identify investment needs and anchor investment decisions. The development of a limited set of representative visions is a process which can only be done with involvement of all impacted stakeholders, who all have their own perspective and know-how.
In the TYNDP 2016 process input was taken via various channels
| Individual stakeholders, organizations | Three public workshops and a written consultation |
|---|---|
| European sector associations | Network Development Stakeholder Group |
| National perspectives | National scenarios created with TSOs, national regulators, ministries, collected via all ENTSO-E members |
| Pan-European views | Regular bilateral/trilateral meetings with EC and ACER |
| Process views | Regular meetings with ACER and an informal opinion from a NRA infrastructure expert team |
At the time of publication of this report, the process for the co-creation of the TYNDP 2018 visions is initiated. In this process, ENTSO-E hopes to continue and intensify the collaboration with the entire sector.
A lot of work and consultation are going into the elaborations of the TYNDP visions. They are not only used in the TYNDP. Various researchers and institutions are applying the TYNDP scenarios in their own analyses, all showing additional insights in what these scenarios can imply, and all giving food for thought on future TYNDP scenarios.
The value of different perspectives
A representative set of visions requires input from a representative set of stakeholders to shape the storylines and assumptions.
Some TYNDP visions have a stronger national focus than others. There is no right and wrong or likely/ unlikely options. Energy policies are shaped at both local and European level. There is thus value in designing visions along both perspectives. Visions 1 and 3 have a more ‘bottom-up’ perspective and are essentially based on national scenarios. Visions 2 and 4 have a strong ‘top-down’ perspective.
The full TYNDP 2016 Scenario Development Report sheds light on how these top-down scenarios are constructed by using methodologies such as centralizing hydro generation investments, re-allocating renewable generation across countries to optimize consumer benefit, and reducing thermal generation overcapacity to more profitable levels. In essence, such exercise shows how a pan-European optimal coordination of support schemes could impact present national scenarios.
National and pan-European policy directions may push for different technologies, capacities and locations of new generation; both resulting in different investment study results. Still national and pan-European TYNDPs are being developed, which both need to be consistent and propose robust investment decisions.
Is there a trend in visions from one TYNDP to the next?
The power sector evolves and TYNDP visions (updated every two years) need to adapt where relevant. The TYNDP 2016 visions for 2030 use a similar naming and framework as in the TYNDP 2014. But there are nevertheless many differences in the underlying storyline and data between the visions of these two editions. Therefore one needs to be cautious when comparing planning studies and project assessments using the scenarios established in 2014 and in 2016.
Some overall changes in the TYNDP 2016 visions set compared to 2014 are the following:
Demand in the TYNDP 2016 visions has been kept at a lower level, in particular for Visions 2 and 3. This decision was taken together with many stakeholders. Indeed even if there is an economic upturn this does not automatically lead to increased consumption due to additional efforts in energy efficiency.
Fuel prices have been updated based on international reference sources, as have carbon emission levies. Next TYNDPs will likely have to catch up with evolution in this field triggered by COP21 and new EU measures.
The European 2030 target for renewables result in higher shares of renewable energy sources (RES) in the Visions 1 and 2. For Visions 3 and 4 the installation and energy generation levels of solar and wind have been scaled down, though with a compensation of lower demand levels, the overall percentage indicators (%RES/demand) remain at similar levels of 55% to 59%.
Also national scenarios are constantly updated, sometime with quite substantial impact. The Regional Investment Plans 2015 also already highlighted recent regional trends which imply an update from the previous set of TYNDP scenarios.
Conclusion
Long-term system analysis and robust grid planning is a complex task. There is no single algorithm to provide a no-regret solution. It requires various types of analyses, on diverse scenarios, and with extensive interaction of impacted stakeholders and experts.
The entire energy sector already realizes tomorrow’s market design needs to adapt and system security coordination needs to be reinforced, to ensure all energy objectives can be met in an optimal way. Also long-term grid planning needs to account more than ever how uncertainty can be addressed, system security risks mitigated, and investment decisions in a system with an ever increasing zero-marginal cost generation promoted.
ENTSO-E takes on board feedback from preceding TYNDPs and scenario-building exercises for each new edition. Also planning studies, technical resilience analyses and project cost/benefit assessments need to evolve.
Need more?
- Scenario Development Report, published November 2015
- Market Modelling Data set, published November 2015