Viability of the energy mix
The energy mix has been and is facing significant changes accross Europe, with a signficant increase of production of electricity from renewable sources. While it leads to significant reduction of CO2 emissions of the power sector, it creates some additional challenges both from the technical and economic point of view that are being described further in this Insight Report.
Viability of the energy mix
Introduction
The energy mix represents the combination of different type of generation sources that are necessary to meet demand over a given period. Figure 1 shows the annual energy mix as considered in TYNDP16 for the pan-European system and the five synchronous areas in the mid-term best estimate scenario of “Expected Progress 2020 (EP2020)”.
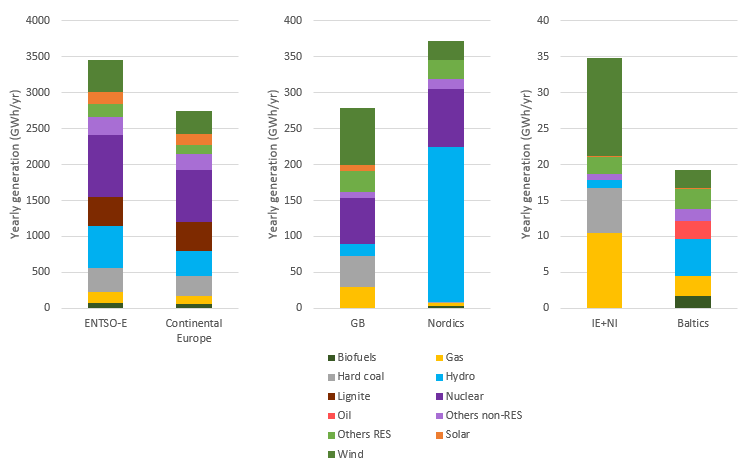
Figure 1 EP2020 Energy mix. Annual split in ENTSO-E and the five synchronous areas.
At any given time, a set of generating units will be providing the power necessary to meet demand. Market decisions and eventual technical restrictions will largely determine this set of generating units, which will vary considerably throughout the year.
The European energy targets for 2020-2030 establish the share of renewable energy in the electricity sector to increase to at least 45% in 2030. Having in mind this future RES integration and the highly changing market decisions one can expect, in all systems, an increased number of hours with very high RES percentage and many different generation patterns in terms of source type and location. All those situations bring specific technical and economic challenges, which must be analysed in order to find the most adequate and timely measures to manage system operation.
The hourly energy mix reveals the technical challenges faced by TSOs. The annual energy mix, on the other hand, reveals the economic challenges and the profitability risk that thermal plants might face due to the reduction of equivalent full load hours and of marginal electricity price.
The following chapters present an insight into some of those aspects looking at the long-term 2030 TYNDP visions.
Technical challenges
From a wide system perspective, reduction of total system inertia, voltage management, widespread voltage dips and balancing generation and demand are relevant challenges resulting from high shares of RES integration.
Next table presents an overview of challenges associated with high RES and the mitigation actions identified:
| Challenges | Issues | Mitigating actions |
|---|---|---|
| Reduction of system inertia | Total system inertia ROCOF Frequency containment |
|
| Voltage | Voltage control means Voltage dips |
|
| System strength | Fault level for converter stable operation Fault current for protections |
|
| Need for flexibility | Balancing |
|
Reduction of system inertia
Background
The energy stored in the rotating masses of the synchronous generating units, by virtue of their inertia, provides means of instantaneously balancing any mismatch between the primary energy supplied to generating units and the total system demand including losses.
The immediate inertia action results in a change in rotor speeds and, consequently, the system frequency. These frequency excursions are monitored by frequency response providers who will vary the power output of their plants to contain and restore the balance between generation and demand.
Whereas inertia itself does not solve the power mismatch problem in a sustainable manner, it is essential for instantaneously handling this mismatch until frequency response is able to catch up. With very lower inertia, the system would experience higher frequency excursions and may even run into demand disconnections and blackout as result of a minor mismatch between generation and demand.
The rate of change of frequency (ROCOF) is determined by the initial mismatch in power and the total system inertia at the time the mismatch took place. The higher the mismatch between load and generation and the less the inertia, the higher becomes the ROCOF.
Foreseen trends
Unlike conventional generation technologies, RES are not intrinsically capable of providing the same inertial response. This is either because they have no rotating masses or because the energy stored in the rotating masses is decoupled from the system by power electronic converters.
As the connected capacity of RES increases, and as their contribution to the energy mix increases, the total inertia of the system will be reduced for extended periods of hours.
Figure 2 presents the estimates of system inertia in the EP2020 and the four 2030 visions for Continental E urope and Great Britain synchronous areas. A set of assumptions was taken to make this estimates, hence values should be seen as an indication of the trend and of the range between maximum and minimum values.
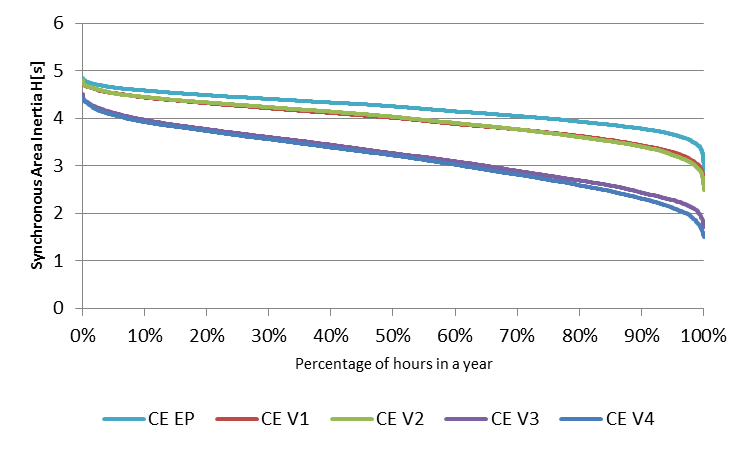
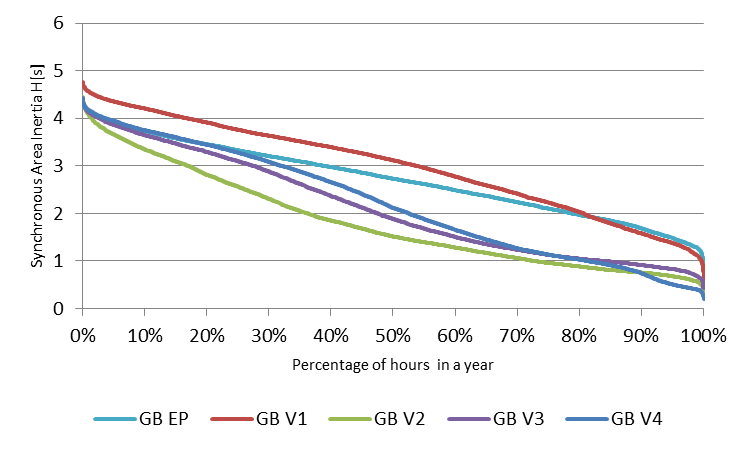
Figure 2 Percentage of hours in a full year where estimated inertia is above a given value. Synchronous area equivalent inertia H[s] is calculated on the basis of online generators capacity. Examples of Continental Europe and Great Britain synchronous areas. EP2020 and 2030 Visions: V1 “Slowest Progress”; V2 “Constrained Progress”; V3 “National Green Transition”; V4 “European Green Revolution”
Taking into account TYNDP 2016 market results, shown above for Continental Europe and Great Britain, system inertia reduces in all synchronous areas from the situations closest to today to the visions with a higher integration of RES. Even in Continental Europe, reduction of inertia is clearly noticeable in those abovementioned situations. In Great Britain, where number of hours with very low inertia is higher, concerns due to reduced inertia have a larger impact.
In all cases, frequency sensitivity (ROCOF and frequency excursion) to generation-demand unbalance incidents is expected to increase.
Inertia creates time for the adaption of power feeding into the network by the frequency containment means responding proportionally to the frequency deviation (‘Frequency Sensitivity Mode’ or ‘Limited Frequency Sensitivity Mode’). If inertia is decreasing, less time is gained and as a result, the frequency containment reserves must be activated faster to avoid excessive frequency excursions.
Solution needs and mitigation measures
Different solutions and mitigation measures contribute to securing the power system performance.
Frequency containment provision by other sources than synchronous generation: converter-connected generation, demand side response, storage and reserve shared between synchronous areas using HVDC.
Implementation of the Connection Codes: critical to ensure that the necessary technical requirements related to synthetic inertia, frequency sensitive mode and robustness against high ROCOF are put in place. The capabilities required by the network codes provide solutions that should be understood in a holistic and balanced approach in terms of its implementation both at transmission and distribution level.
Limit the size of the largest imbalances: large imbalances will become increasingly more challenging to secure and is an issue with cross-border impact.
Use synchronous compensators (SCs): decoupling generators to become SCs under changing operating conditions in real time from generators such as GTs and CCGTs or permanently from decommissioned nuclear (Germany).
Constraining RES and placing synchronous generation in the unit commitment: While synchronous generation at technical minimums provides inertia to the system, constraining RES might be a less efficient solution (maybe a short-term solution).
Voltage management
For highly meshed areas with an “optimal” distribution of synchronous generation units around the consumption areas, static limits, like thermal ratings and over/under voltage in substations have usually been the limiting factors.
The increase of penetration of electronic driven and controlled sources and penetration of decentralized generation combined with increased cross-border energy exchanges has been leading to new kind of voltage related issues.
| In case of: | Effects | Consequences: |
|---|---|---|
| High RES infeed | Less automatic reactive reserve in the system from synchronous units; Reduced voltage support in case of short circuits | The voltage restoration ability is reduced; In case of short circuits, the affected area becomes larger. The interdependency in voltage and short-circuit support among areas/TSOs is increased. The uncertainty regarding power flow directions and the spread between low load and very high load put extra needs in voltage control; Considering weaker voltage sources directly connected to the transmission system, maximum transmissible power will become more and more important and represent a cross-TSO issue. |
| High penetration of decentralized generation | Less automatic reactive reserve in the system from synchronous units; Reduced voltage support in case of short circuits Active power flow across the transmission system is reduced; Reactive power flow pattern exchanged with the transmission system changes | |
| High imports into a region | Less automatic reactive reserve in the system from synchronous units; Reduced voltage support in case of short circuits |
Solution needs and mitigation measures
Different mitigation options are necessary to contribute to securing the power system performance:
Investments on the network side: synchronous condensers, SVCs etc. to maintain stability should keep up with the investment in converter-based generation to avoid curtailment of this type of generation.
Implementation of the Connection Codes: Displacement of conventional generation and highly changing pattern of generation will need voltage control means from all types of generators at different voltage levels. More pronounced voltage dips also imply ‘Fault Ride Through’ needs in all voltage levels.
Need for flexibility
High RES installed capacity and zero marginal costs of RES tend to displace conventional generator units from the market. Unlike conventional generators with costly but controllable sources of primary energy, primary energy for RES is free but has a variable nature. Hence, RES deviations due to under or over supply, must be balanced in order to maintain the frequency equilibrium.
The following graphs show residual load ramps (load minus RES) for different scenarios and specific regions being either synchronous areas, or some so called electric peninsulas with limited interconnection capacity to other countries. Scenarios with high RES integration display strong ramps of available conventional generation and demonstrate the need for new flexibility sources.
| [MW/h] | Iberian peninsula | Nordics | Baltics | UK | Italy |
|---|---|---|---|---|---|
| EP2020 | 6120 | 4637 | 544 | 8830 | 8060 |
| Vision 1 | 6893 | 4624 | 656 | 8201 | 8723 |
| Vision 2 | 9350 | 4326 | 572 | 10355 | 7438 |
| Vision 3 | 7387 | 4179 | 552 | 13788 | 9003 |
| Vision 4 | 14340 | 4366 | 584 | 10460 | 9429 |
Figure 3 Duration curves of hourly ramp of residual load - example of Iberian Peninsula
Solution needs and mitigation measures
Different mitigation options are necessary:
System interconnections – Interconnection relieves strong ramping since deviations are balanced over a network covering a wider area. In this case variability and predictability challenges of RES sources dilute, which in turn reduces uncertainty and offers a form of flexibility.
New flexibility sources at relevant timescales – Classical sources of flexibility (classical generation) are displaced due to RES. In order to cope with this situation new flexibility sources may enter into play both from the offer and demand side, e.g.: new roles for thermal plants, RES participation, demand side response, storage.
Mitigation options will be complementary. In a system highly interconnected, it is likely that flexibility needs disperse. Conversely, in a system with weaker interconnection flexibility needs will see increased procurement. Transmission projects may provide additional benefits in terms of flexibility means.
Investments to allow large power flows covering vast distances and flexibility rewards to providers will be central aspects to the solution.
Additional perspectives on the generation mix
The development of generation and demand scenarios built for the TYNDP start with the definition of the storyline of each scenario through an extensive stakeholder involvement. The next steps include: assumptions, data collections, quality checks, pan-European methodologies, and final market simulations to quantify energy outputs.
The scenarios are built to be adequate which means sufficient generation is available in every hour of the year to cover the ENTSO-E electricity demand assuming normal conditions (weather, outages) take place. This characteristic is essential to ensure scenarios can be used for a sound Cost Benefit Analysis. However, questions have already been raised at the time of TYNDP 2014 on the risk for the profitability of the generation portfolio included in these scenarios1.
The increase of RES installed capacity puts out of the merit order the most expensive thermal generation technologies. Several technologies see their equivalent full-load-hours going down, being replaced by RES-based electricity generation. The magnitude and generation technology impacted varies depending on the CO2 price assumed within each scenario. In addition, the number of hours with zero marginal cost increases from 2020 to 2030, correlated with a higher coverage of electricity production from RES with zero marginal cost.
These two aspects are shown on Figure 2 taking Great Britain as an example with the marginal cost curves displayed for both 2020 and a 2030 scenario (Vision 3). Compared to 2020, the 2030 scenario sees an increase by around 30 GW of wind and solar installed capacity in Great Britain combined with an increase of the CO2 price and electricity demand. Globally, the marginal cost curve is moved upward as well as shifted to the left, with a significant increase of the number of hours with zero marginal cost. This is a trend seen in most of the countries with see the same change of generation technologies.
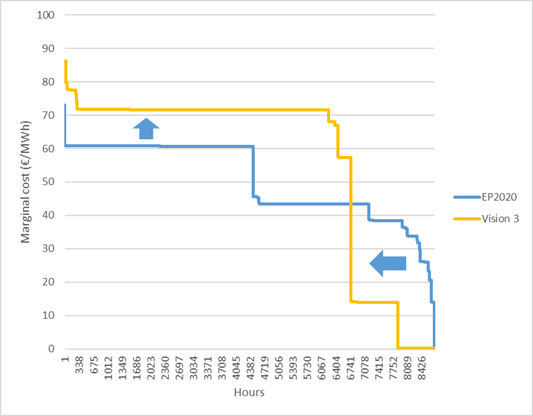
Figure 4 Marginal cost duration curve in GB for 2020 and a high-RES 2030 scenario (Vision 3)
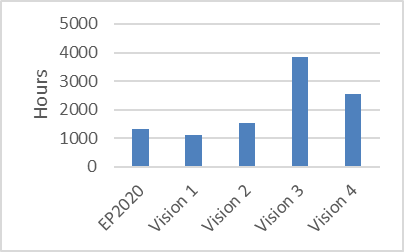
Figure 5 Number of hours with at least one zero-marginal cost country
These figures open the question of the profitability of the energy mix assumed in the scenarios. It is worth noting the models currently used consider only the day-ahead market, but do not value the additional services provided by both generation and transmission assets (e.g. capacity contribution to SoS, contribution to system flexibility..,). The market studies model the energy-only part of the power market model revenues. It amounts for about 200 bn Euros per year for all the power plant portfolio in 2030 Vision 3. Considering a possible investment cost (with a 0% discount rate) for the total generation portfolio and adding OPEX leads to a figure in the order of magnitude of the revenues modelled. Comparing these two figures question the profitability of the generation mix if considering only as services they provide the selling of electricity on the spot market. Subsidies for some technologies, or Capacity Remuneration Mechanisms would probably complement the revenues modelled here to ensure a secure system.
Conclusions
The system is evolving in a complex manner and with increased cross-border interdependency. Hence, a systematic approach from the planning perspective in analysis including inertia, voltage and flexibility is advisable in order to ensure the correct measure of the emerging challenges and the maintenance of system security. This analysis should provide comparable results among the TSOs and could help to take timely and economical solutions or mitigation measures. TYNDP is an opportunity to bring that coordination together, provide objective assessments and highlight the most relevant challenges and solutions.
TYNDP2016 delivers the necessary transmission infrastructure but in order to make the energy mix viable it is essential to look at the future from a system perspective. The implementation of the Connection Codes to ensure the necessary technical requirements to grid users and the implementation of Europe’s electricity market to ensure aspects such as reward to system flexibility and incentives for market participants to act in line with system needs are also key priorities.
See ACER’s opinion on the SOAF 2014 ↩