Data and expertise as key ingredients
The TYNDP is an open process. This report will give you the list of data sources and tools used by the ENTSO-E experts to make the TYNDP and what you can freely access to support your own research.
Sharing data and knowledge
This report gives an overview of the data, formats, and tools applied by ENTSO-E’s experts in delivering the TYNDP. It aims at raising the public’s awareness to the fact that a lot of TYNDP underlying data and maps is made freely available by ENTSO-E.
ENTSO-E believes that all institutional and non-institutional stakeholders should be able to access the TYNDP data. It improves understanding of the TYNDP’s results and recommendations, fuels in discussions on future TYNDP studies and can support additional research related to grid development.
The main gateway to access ENTSO-E’s data is the transparency platform.
The platform required under Regulation offers close to real time data on generation, electricity cross-border exchanges and consumption for the whole ENTSO-E area. The data is collected from transmission system operators (TSOs) but also power exchanges or other market players.
Prior to the platform, ENTSO-E published key figures through its data portal. Data from pre-ENTSO-E associations are still available through the ENTSO-E website.
In line with this long tradition of allowing public access to fundamental data on the EU power system, ENTSO-E is also publishing the TYNDP datasets. There are some exceptions to the general transparency rule when the data fall under some national confidentiality legal obligation or their access is limited to ENTSO-E by contract. These exceptions are regularly reviewed with the aim of moving towards more and more openness. Should you have any suggestions or recommendations, we invite you to share them with ENTSO-E.
Market data
A basic element in any long-term grid development study is the set of scenarios applied (see our insight report on “Future system perspectives”). Each TYNDP 2016 scenario sketches a possible future for the European power system in 2020 or 2030. Each contain the following elements:
installed generation capacities per technology and country;
consumption profiles;
border reference capacities;
key assumptions for generator efficiencies, fuel prices and CO2 prices.
Some of the scenarios are based on collections of national data. Others are the result of pan-European optimisations in the location of renewable energy sources (RES), in the sizing of thermal generation, and adaption of load profiles. A fully detailed overview of the TYNDP2016 scenarios can be found in the Scenario Development Report which was widely consulted in various steps of the TYNDP process.
Most data used for the TYNDP scenarios can freely be accessed from this database. Detailed elements such as efficiency assumptions per generator, operational restrictions and maintenance profiles, smaller market node data, and climatological data for hydro, wind and solar are not included in this set.
Market simulation tools
The TSO’s experts collaborating on TYNDP studies use a variety of market simulation tools to design the scenarios, conduct planning studies, and perform calculations for the cost and benefit analysis (CBA) of projects.
The tools used in TYNDP studies are among others:
| Main characteristics of modeling tools | BID | ANTARES | PowerSym |
|---|---|---|---|
| number of simulation days | 365 | 364 (52 weeks x 7 days) for economic simulations , 365 for adequacy simulations | planning calendar: 52 independent weeks (364 days) or real calendar: 365 or 366 days and linkage between weeks |
| resolution of results | hour, year | hour, day, week, month, year | hour, day, week, month, year and fiscal year |
| probabilistic / deterministic | deterministic (probabilistic analysis of hydro) | Deterministic, deterministic with deratings, Monte-Carlo (full random draws or partly user-defined scenarios). Uncertainties regardingplanned and forced outages of thermal units, hydro inflows and reservoir levels, wind and solar intermittency, load variability | Deterministic, deterministic with deratings, Monte Carlo draws (smart or random) with uncertainty regarding unit outages, Hydro conditions, wind variance, load variance, transmission link ratings |
| possibility of modelling of start-up cost (yes/no) | yes | Start-up as well as fixed costs are not taken into account in the initial unit commitment but are incorporated ex-post in the final optimal dispatch (seamlessly from one week to the next) | Start-up costs are modelled explicitly, included in total costs and included in unit operating decisions |
| reserve modeling | no | Different options are available : prescribed (spinning reserve is a fixed percentage of available power, adjustable for each thermal cluster) or optimized (the reserve required in any given node is defined as a 8760-array of power that is added temporarily to the local load - and must be served at minimal cost as any load. This fictitious load is eventually removed from the final optimal dispatch but its initial involvement makes sure that it duly participates to the unit commitment. | A very detailed reserve model of spinning, operating, and turn down reserves, that may be specified by any combination of system, control area, and individual area. Generating units may be required to contribute a specific amount of reserve (MW or percent) if on-line and the amount contributed by a generating unit may be limited by its ramp rate or by a specific maximum contribution (MW or percent). Quick start and non-firm resources are modelled. |
| hydro storage generation modelling (fixed/optimized) Reservoir management (yes/no) | optimizedyes | optimization of monthly energies possibility of modeling reservoir capacity | Hydro stations are represented by reservoirs with weekly energy allocation and hourly minimum and maximum generation levels. The hydro dispatch has the objective function of leveling loads (including wind and solar inputs) or of being dispatched against the system marginal cost curve.A recently added algorithm models individual reservoirs linked in a cascade with both generation and pumping options. In this model, hydro inputs are natural inflows and upper and lower bounds for the elevation of each reservoir plus turbine flow rates and efficiencies. All bounds are respected and water flow is tracked through the cascade. |
| pumped storage modeling (fixed/optimized) | optimized (weekly optimization only) | optimized (daily/weekly) or fixed Propose for pan-EU studies: optimization (no fixed chronicle available in PEMMDB) | Optimized, uses pumped hydro resource to minimize system costs across the weekly horizon. Storage capacity (both upper and lower) is modeled. Efficiency rate of pumping-generation cycle is modeled. Optionally, pumped hydro stations can be dispatched to specified weekly capacity factors. In a very large system, computation time can be conserved by allowing some pumped hydro stations to optimize and dispatch others to a fixed capacity factor. |
| cost of energy not supplied | Included | Included | Included |
| cost of curtailment | RES will be curtailed at additional cost of 0€/MWh | penalty is possible but usually set to 0 (hourly cost of curtailment = hourly cost of marginal generation) | Curtailment options may be included as a dispatchable resource with a cost function. The cost function and size of the resource may vary by week or by season. |
| maintenance optimization | Fixed rate as specified by LAC | no (randomly generated, or fixed in advance) | The maintenance schedule options are available:1. A fixed main tenance schedule may be input;2. The model can compute a maintenance schedule based on leveling weekly loss of load probability. This schedule may be output for use in other studies;3. The model can compute a maintenance schedule based on minimizing annual production costs using a fast cost approximation algorithm. This schedule may be output for use in other studies |
| modeling of minimal time up/down (yes/no) | yes | yes | yes |
| modelling of ramp up/down rates (yes/no) | no for power plants for interconnectors, the model could handle it if data were supplied | no | Unit ramp rates are enforced and are recognized by both the spinning reserve logic and the dispatch cost optimization. |
| possibility of modelling multiple constraints (example: max imports from BE+DE to FR < 4 GW) (yes/no) | yes | yes | yes |
| Possibility of modelling line losses (yes/no) | yes - but not used Cost of 0,01 €/MWh for interconnectors is used to prevent unrealistic flows | no | yes |
| Possibility of modelling physical flows | no | PTDF matrix : yes Impedances: yes Only NTC modelling will be considered in Pan-EU MS |
|
It is key to understand this number of tools does not give a biased outcome to particular studies or regions. On the contrary, the common exchange of results, questions and expert suggestions stimulates a better understanding of different commercial tools and possible results. It ensures various input assumptions can be cross-checked. And it gives more insight in the inherent uncertainty ranges that should be attributed to TYNDP results.
The TYNDP experts use the same standards for data input and exchange. They use a common reference dataset (see Market data). This reference dataset is in line with the CBA methodology and respectful of additional ENTSO-E guidelines in terms of IT applications for TSO use.
All market studies, with whatever simulation tool, are done for the whole ENTSO-E perimeter. They are all performed based on a full-year 8760 hour dispatch optimisation.
For particular infrastructure projects more detailed modelling assumptions were tested, such as climatic conditions, multiple market nodes, redispatch optimisations, hydro constraints, etc. Where relevant this is indicated in the TYNDP project sheets to explain the CBA assessment results.
All TYNDP market studies were directed by a central coordination group to ensure all regional groups and TSOs can perform detailed high quality studies, review them with regional colleagues, in an overall consistent manner.
Grid data
Although pan-European grid data is often perceive as complex and of a critical nature, a lot of it is already available through ENTSO-E’s website.
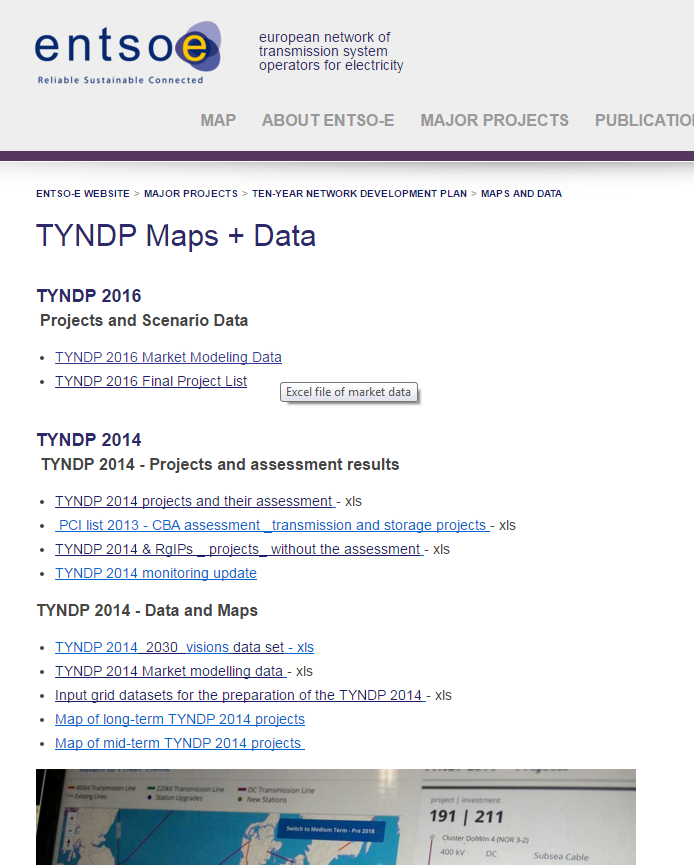
The TYNDP grid data is made available in the form of six regional models (corresponding to the six regional groups in ENTSO-E’s system development committee) covering the whole ENTSO-E perimeter. The models include:
Substations with distinct code names, formulated as single nodes, and with indication of the voltage level;
Megawatt and Mvar1, both in and out of each node in the model (physical injection or aggregation point), for the given planning case;
Impedance and reactance of every line and transformer (without merging);
Lines and transformers reactive characteristics;
Capacities per line transformer.
The applied planning case of each model refers to a snapshot of a TYNDP scenario. Combined with the full TYNDP scenario data sets, these models allow for many insightful load flow studies to be tested. In fact, the TYNDP models are ones of the largest and closest-to-reality models available for research purposes worldwide.
Grid data is already available for the TYNDP 2014 studies and will be made available for the TYNDP 2016.
For anyone interested in testing more dynamic phenomena, ENTSO-E has made available a simpler but dynamic model for the Continental Europe area. The model is able to represent the main frequency response of the system as well as the main inter-area oscillation modes.
Even though it is simplified and partially anonymized in terms of data content, it has been tuned to provide comparable results as the full model. At present the TYNDP planning studies and the project assessments focus on market integration studies and static load flow analyses. But there is a move towards using dynamic planning studies for future TYNDPs (link to PS document).
Grid data exchange and interoperability
As with market studies, also for grid analyses TSOs across Europe apply a variety of tools. For grid analyses the focus on common exchange formats is even higher given the number of data points and their complexity.
ENTSO-E is investing a lot in translating the IEC common information model (CIM) for use by the whole TSO community. ENTSO-E’s Common Grid Model Exchange Standard (CGMES) is a superset of the IEC CIM standard.
The CGMES once finalised will be applied by power system data management tools and tools supporting the following analyses:
load flow and contingency analyses,
short circuit calculations,
market information and transparency,
capacity calculation for capacity allocation and congestion management,
dynamic security assessment.
The development of the CGMES is a collaborative effort between ENTSO-E, the TSOs, software vendors, the IEC CIM User Group and the IEC TC57/WG13. ENTSO-E will continue improving the CGMES to cover additional requirements defined in the European network codes and/or by TSO needs.
This CGMES standard is a must in the seamless exchange of national/regional grid models for TYNDP studies. All TYNDP project CBA grid analyses have been performed by various TSO study groups, based on various tools, but all based on the same central CGMES-compliant data set.
As with market studies, also network study experts coordinated via a central expert group overseeing all CBA application issues and questions to ensure all studies were executed in a consistent approach.
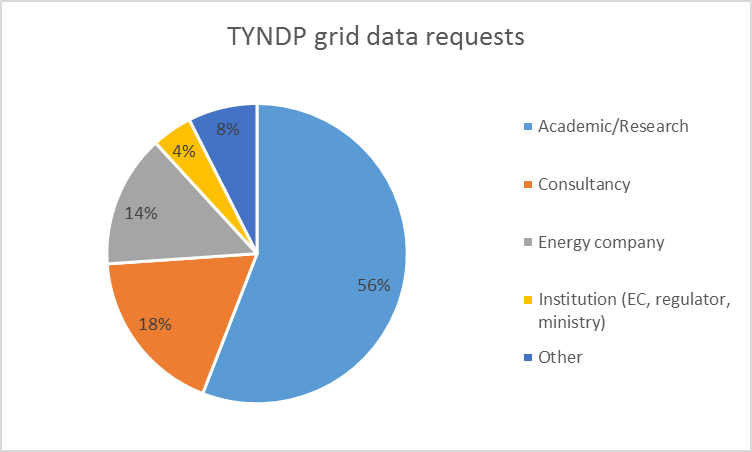
Data usage experience
The TYNDP(2014) grid data sets have been accessed about 160 times over the past year, mostly originating from academics and researchers.
Further improvements of available data
ENTSO-E hopes all interested parties easily find their way to the TYNDP public datasets and see value in applying these in their own studies and analyses.
You can expect the way in which relevant data is shared to further improve in future. To make sure it suits to what you would like to use, we welcome your feedback or suggestions at info@entsoe.eu.
Summary of references
Mega volt-ampere reactive ↩